Who's the Winner for Winter Olympics and ... Why?

This blog shows the process of developing an communicative visualization to show the winner of winter olympics and the underlying reasoning.
Here I want to explore the 'winner' in two aspects: Both extraodanary athletes and medals winned by countries.


Learning Objectives

I want to develop this communicative visualization to achieve the following 5 learning objectives:
(1) The viewers will recognize the countries with most decorated winter Olympians;
(2) The viewers will recognize the countries with the most medals winned in winter Olympics;
(3) The viewers will generalize the relationship between country wealth and winter Olympic performance;
(4) The viewers will compare countries’ performance over time;
(5) The viewers will recognize the popular winter Olympic sports and the best country in them.


A Video First

The video shows the final comminicative visualization solution. In the following parts of this blog, I will show you my thoughts, designs and all the other things along the process. The site is deployed on Heroku

.


Dataset

In order to achieve the learning objectives, I need 2 parts of data: (1) Medals by country and athlete; (3) GDP and Population by country. I found the following dataset for building this visualization:


Visualization Design & Iteration

The wealthier, the better?

Corresponding to Objective (2)(3)(4)


Version ZERO: Intuitive thoughts

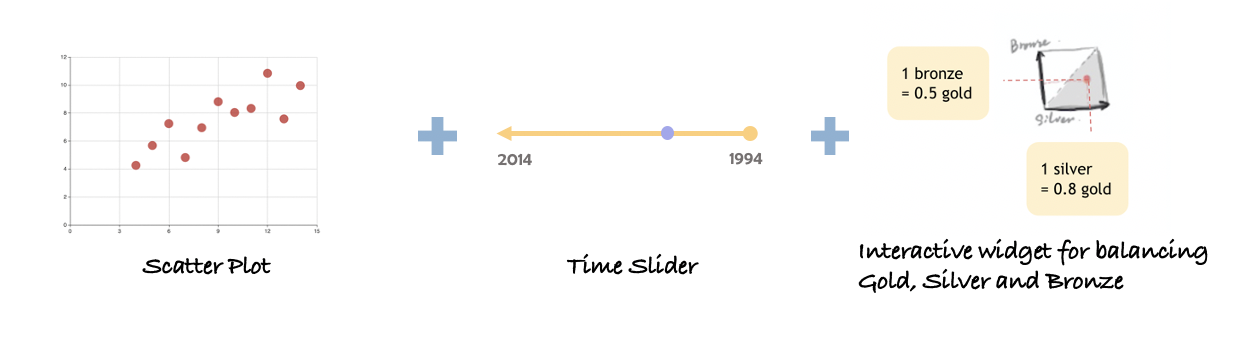
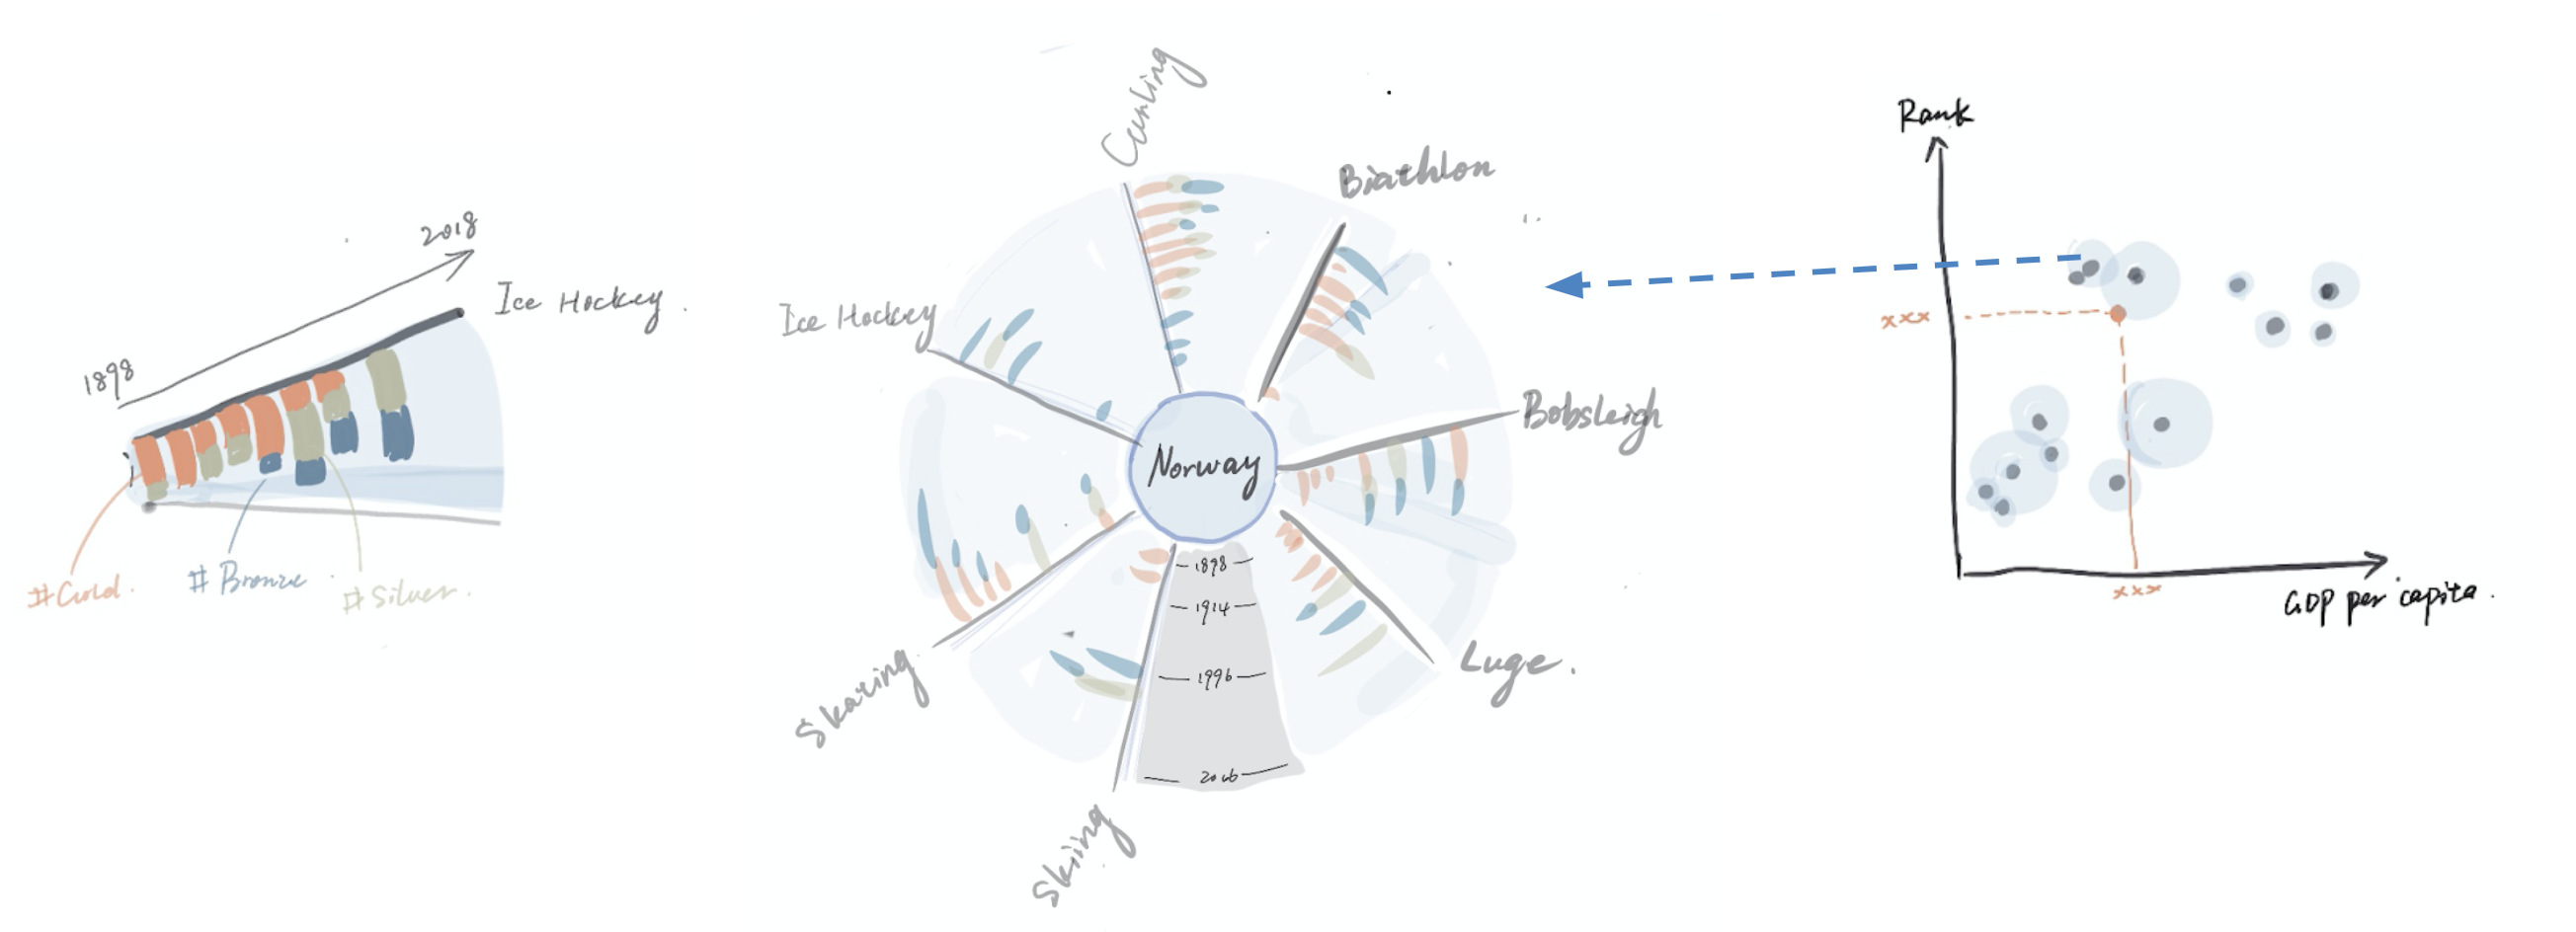
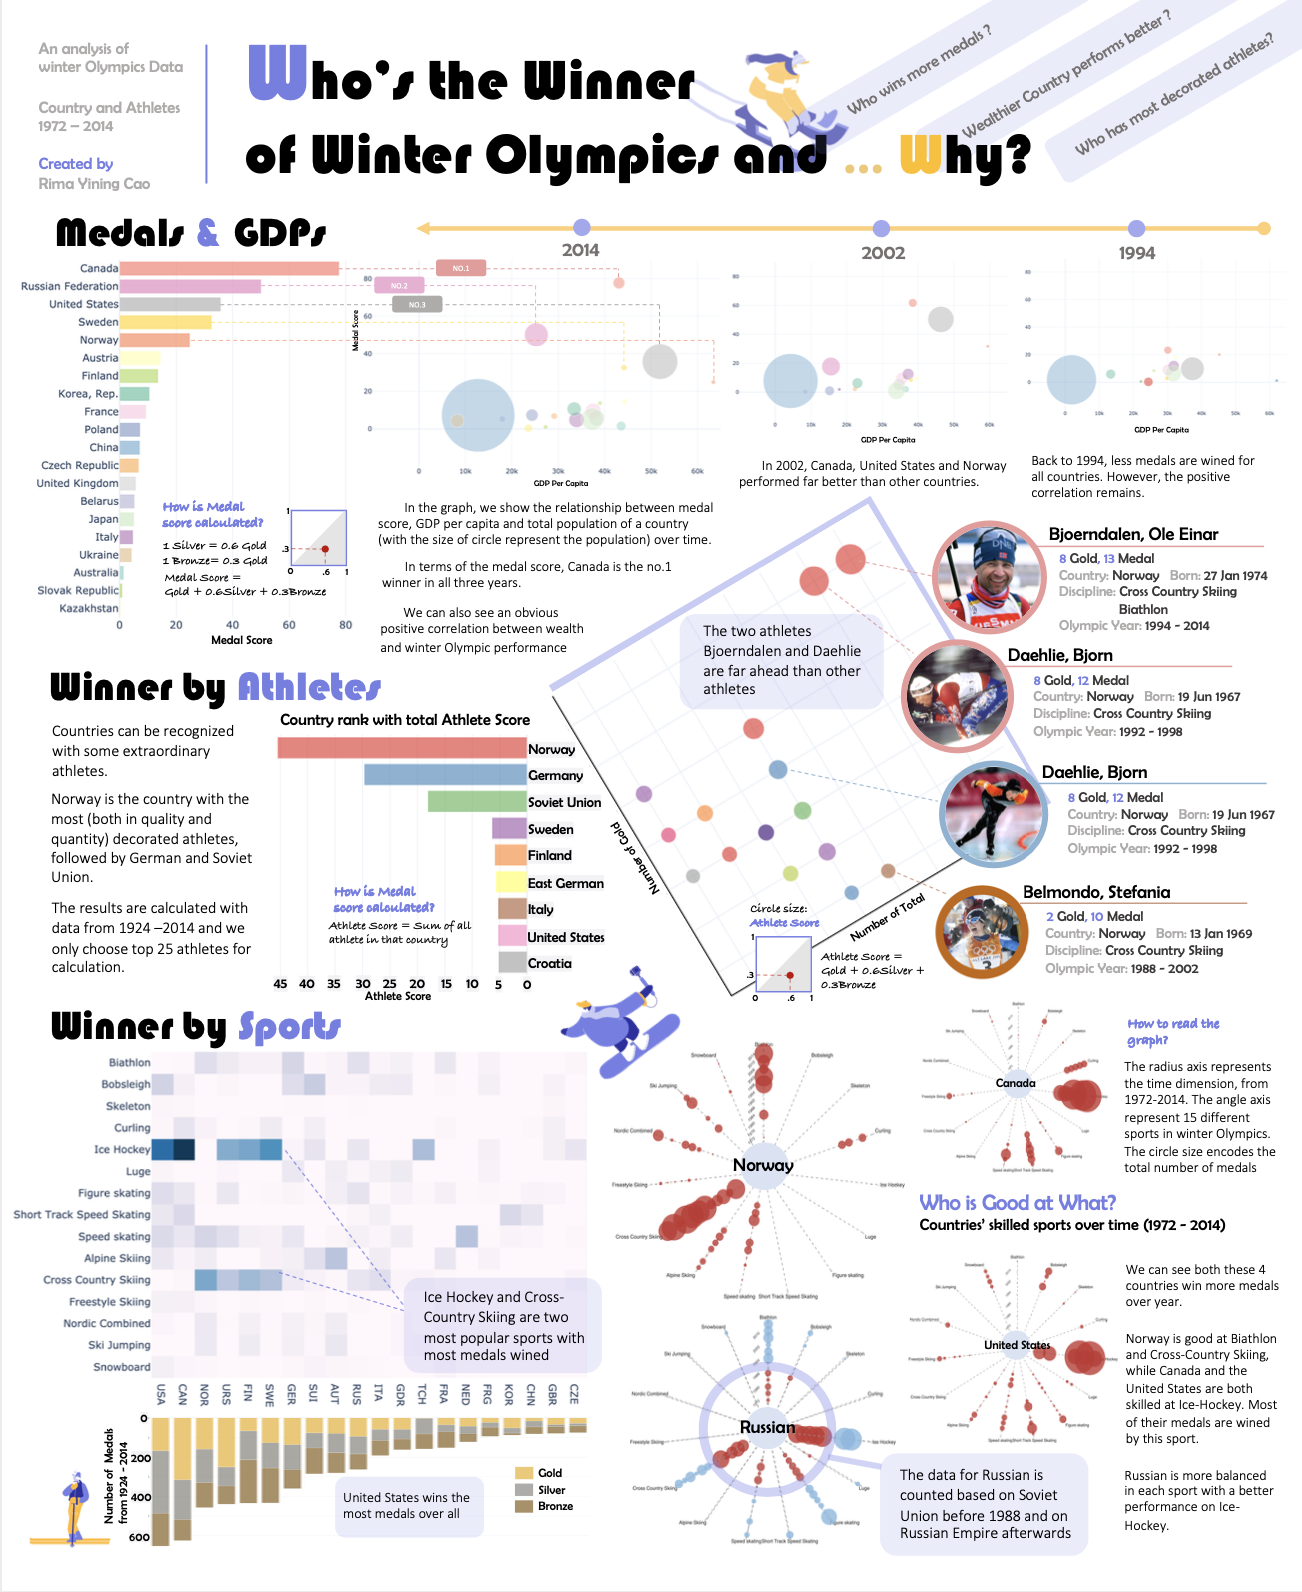
To generalize the realtionship between the country wealth (represented by GDP per capita) and Olympic performance, the first design choice I thought of is to use scatter plot with x,y axis represent each dimension and show the correlation between these two.
The immediate questions are: How to visualize the relationship change over time? How to represent the GOOD Olympic performance?
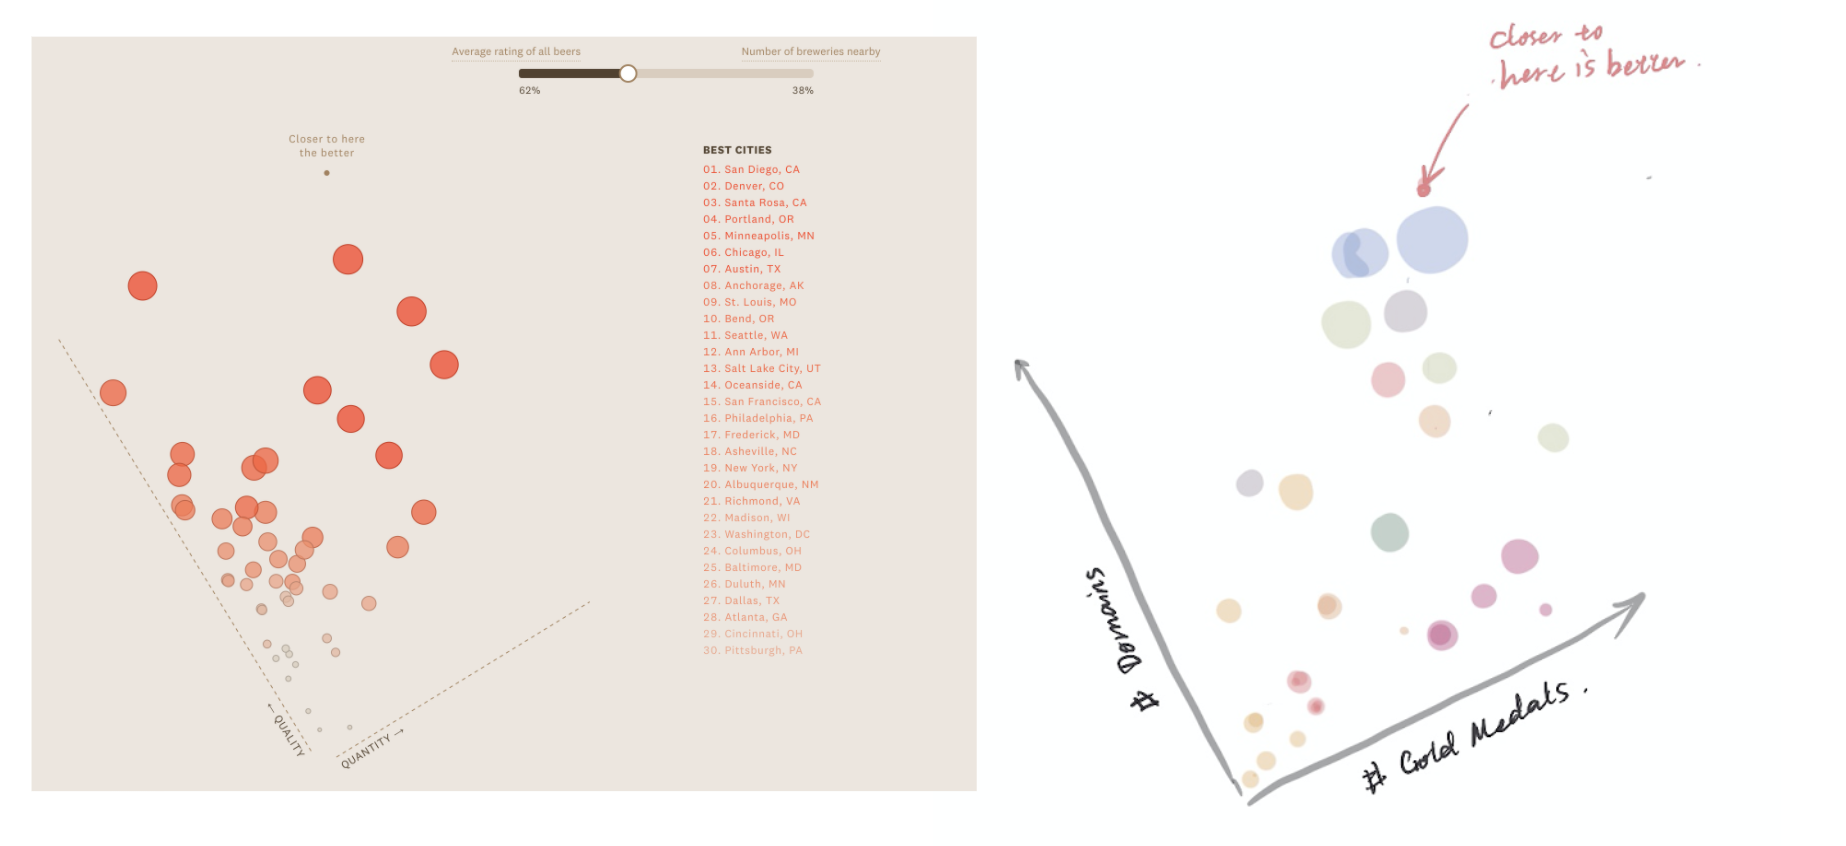
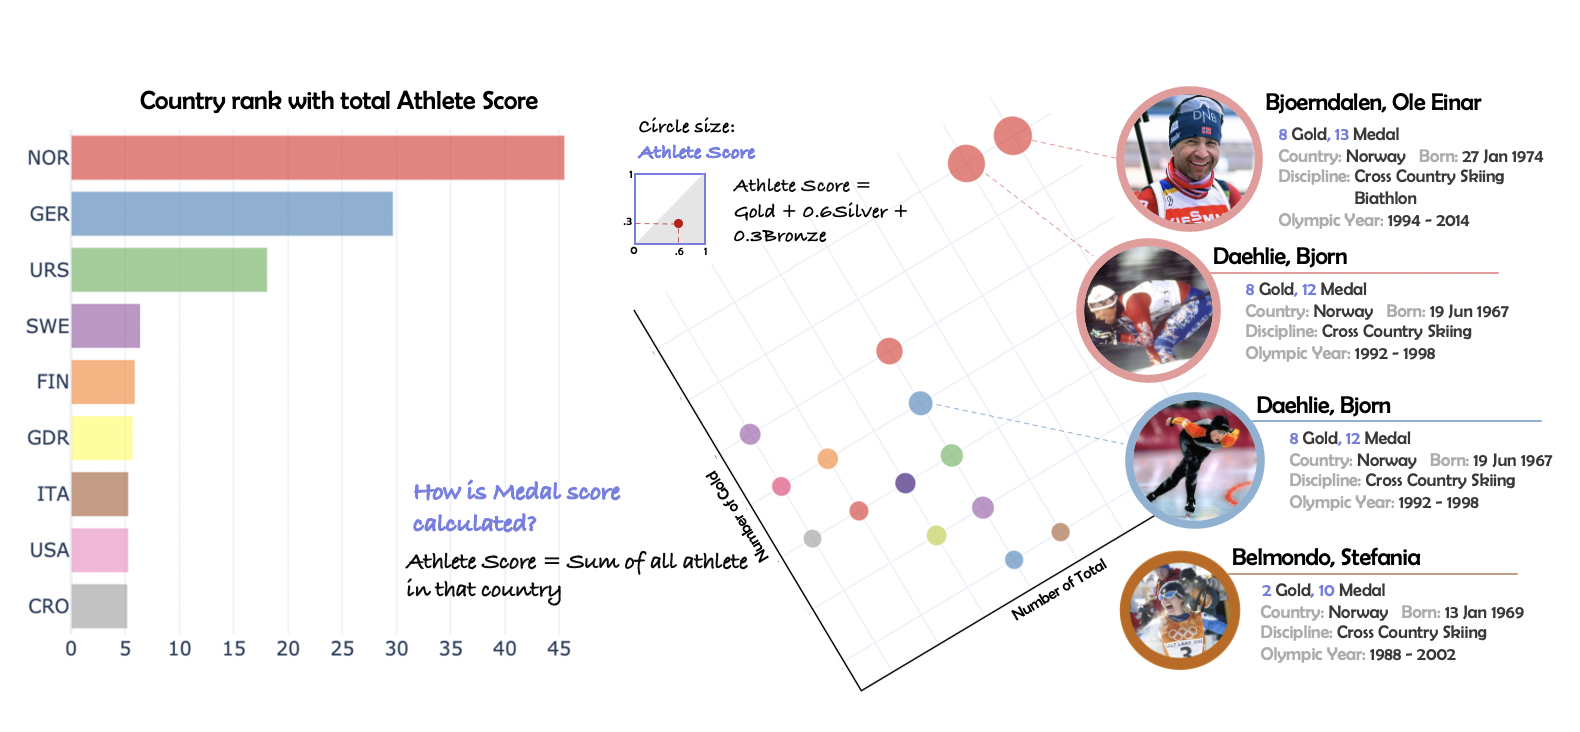
For the time dimension, it is easily to think of using a time slider. For the representation of good Olympic performance, I got the inspiration from an example shown in the flipped class video.


Version ONE: Add More

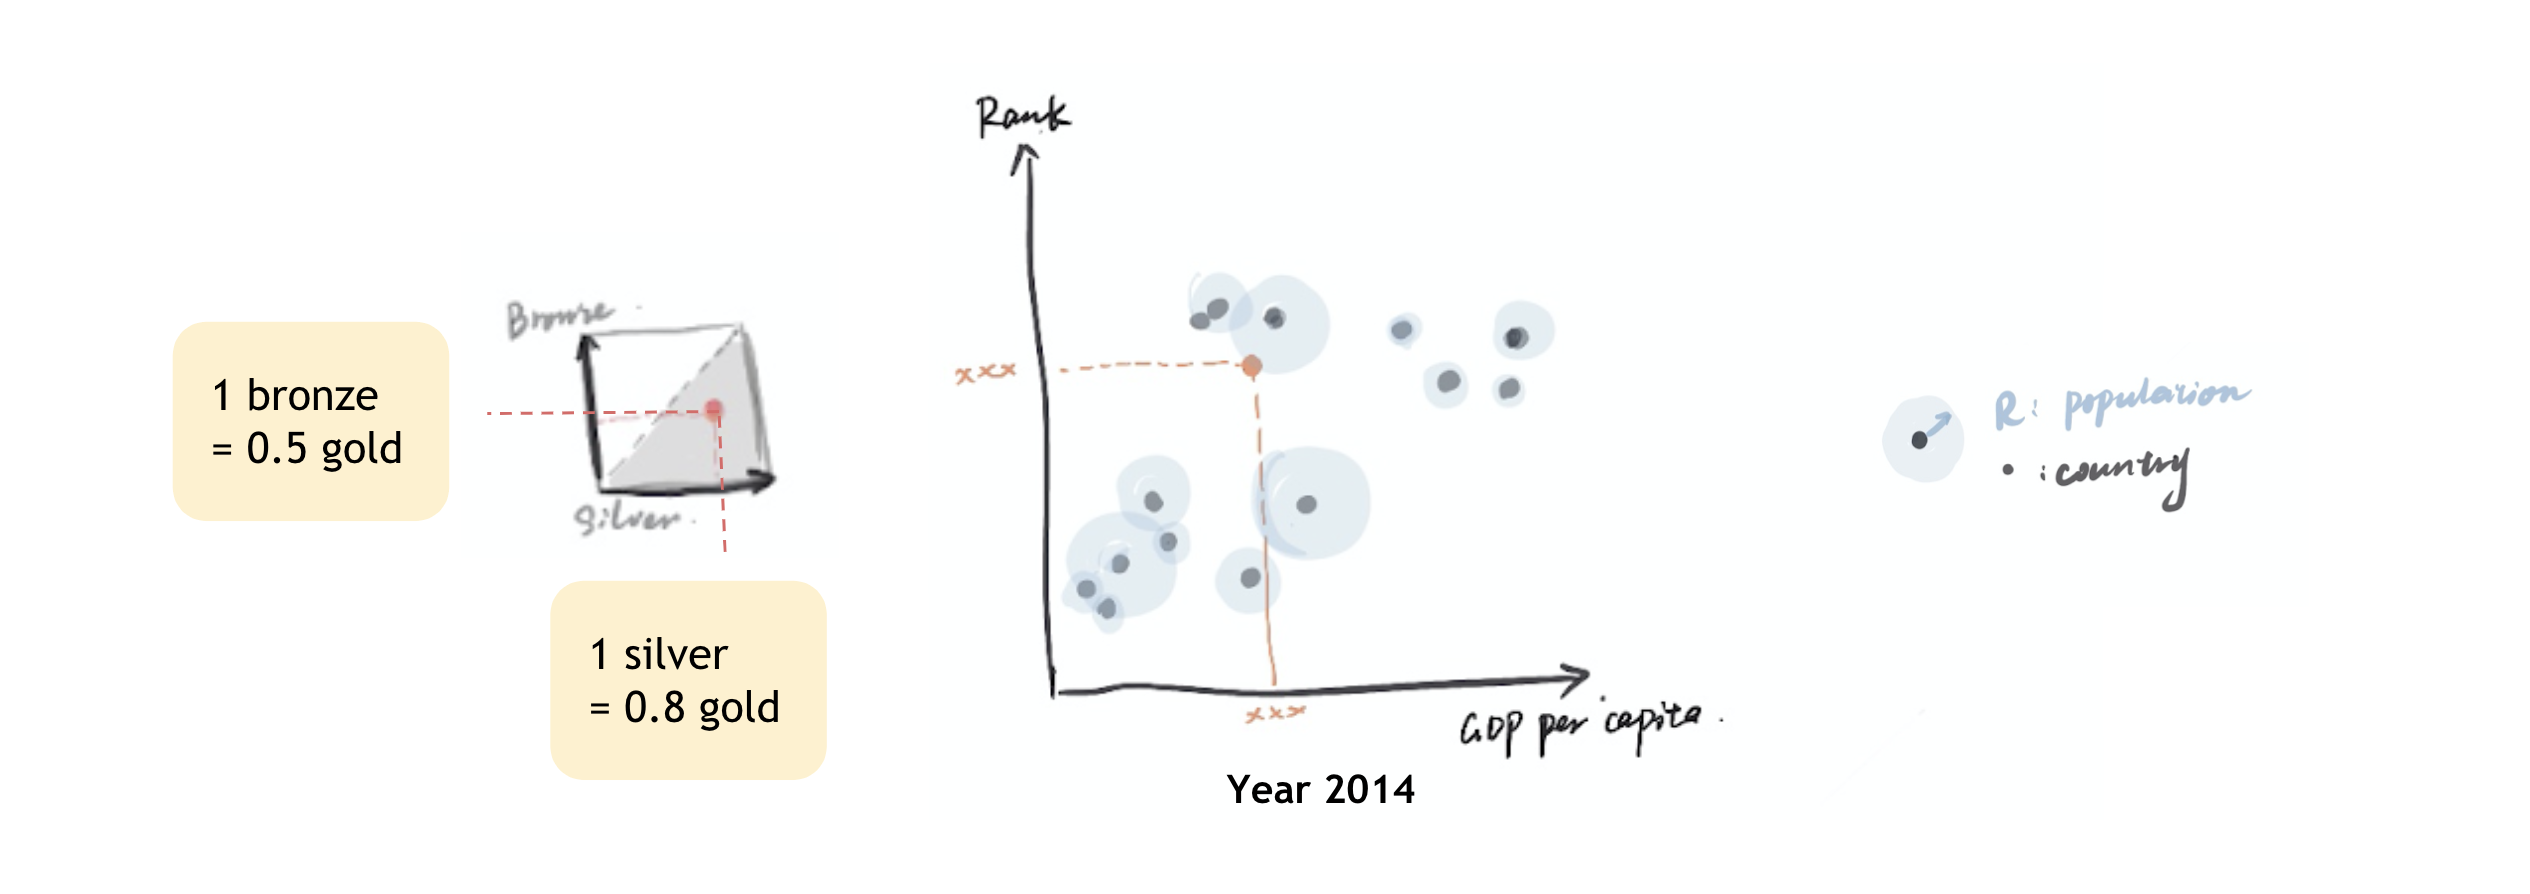
However, the plot with only scatters on it has farely low data density. How about show the information of population on graph as well?
Recall the APT Rule, for the quantitative variable like population, I should encode it using:

position? (used...), length? (no...), angle? (no...), slope? (no...), area? (yes!)

So, I have the solution here:
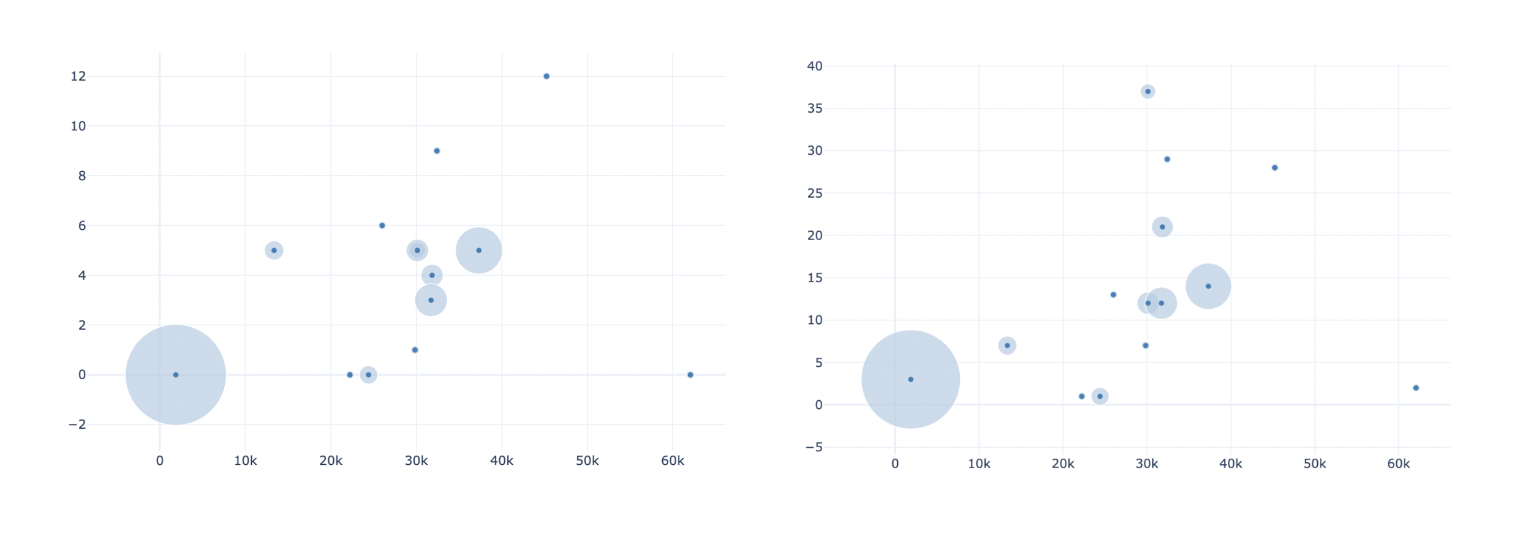
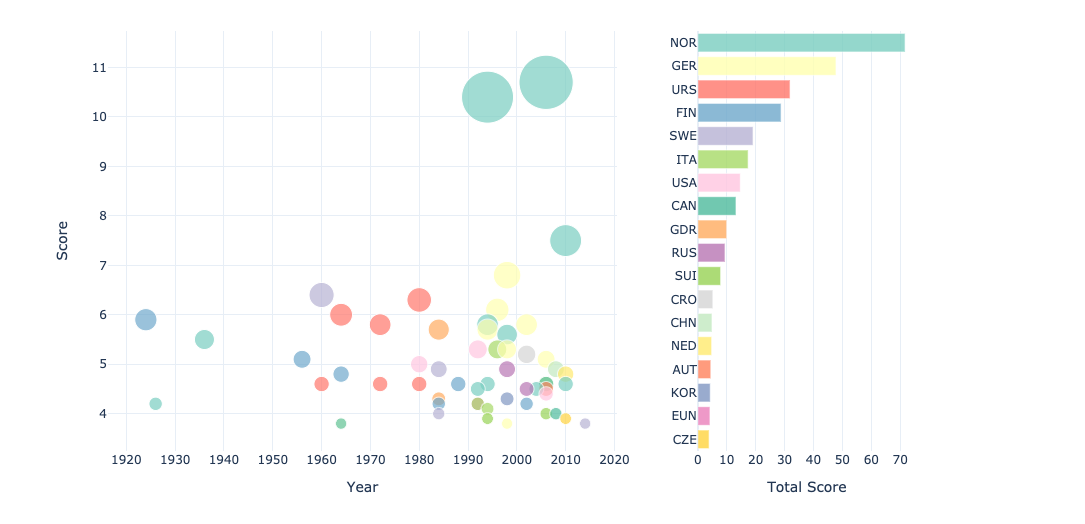
Looks good! But NOT after I visualized it with code:
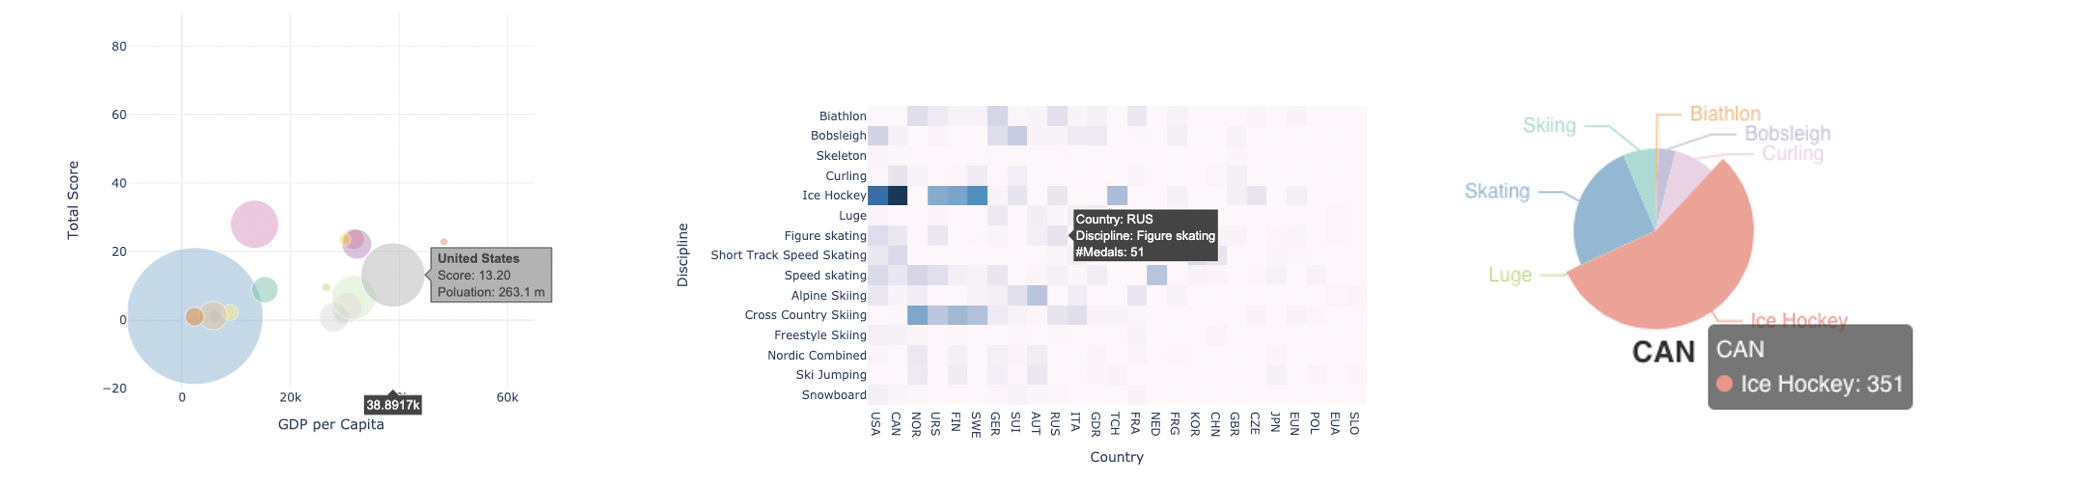
It can show a positive correlation between the wealth and performance. However, the trends for each country are hidden. Although the viewers can hover on the circle to see the country name, they can not intuitively catch the change for each country over time.
Also, the dot in the center of the circle is a little bit wierd...

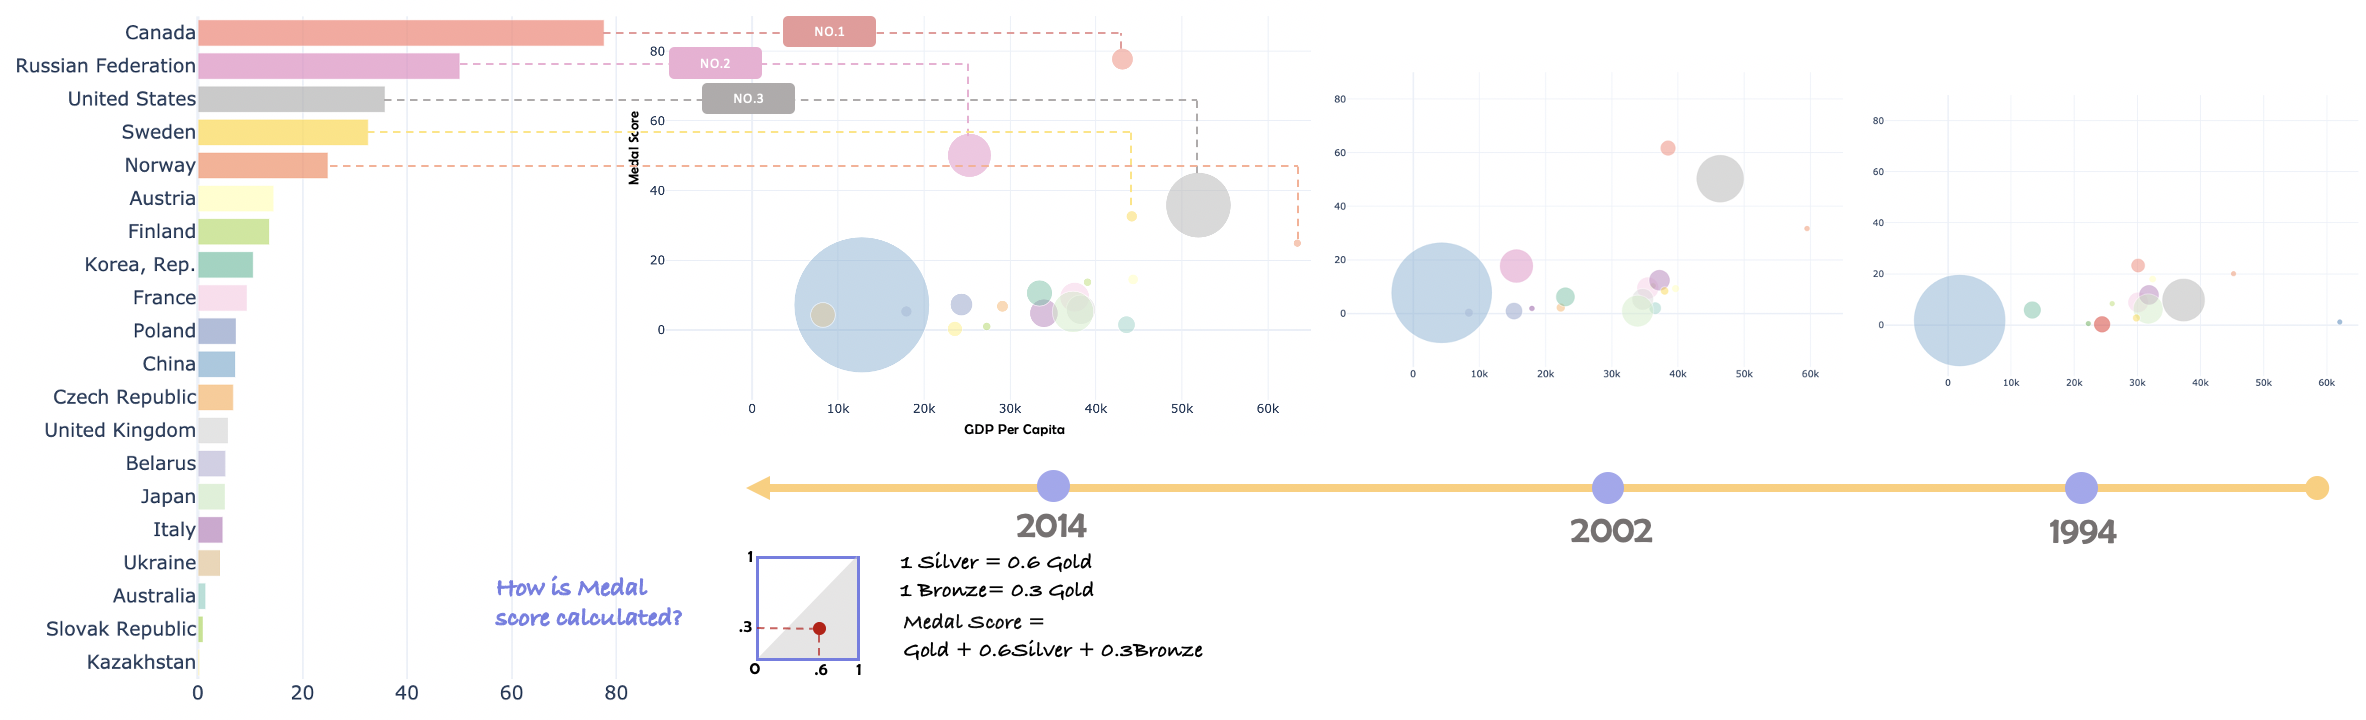
Version TWO: Final Version
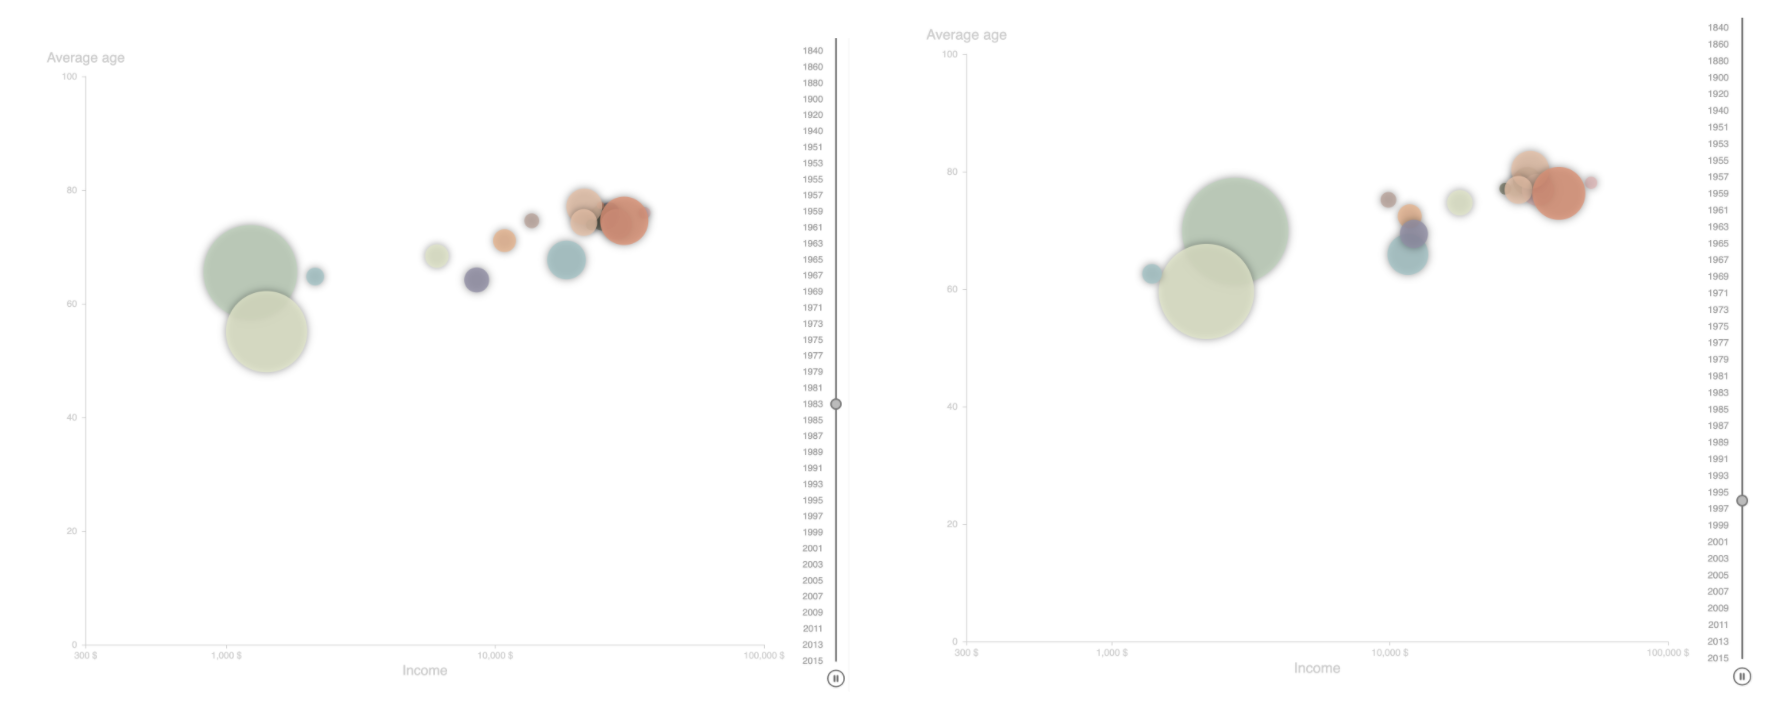
I want to show the countries! Since the country variable is a nominal one, I will use color to encode it.
I also found an example for showing the relationship between life expectancy and Income [here]. It verifies my thoughts that the the trends can be shown with color (and it won't be messy!)

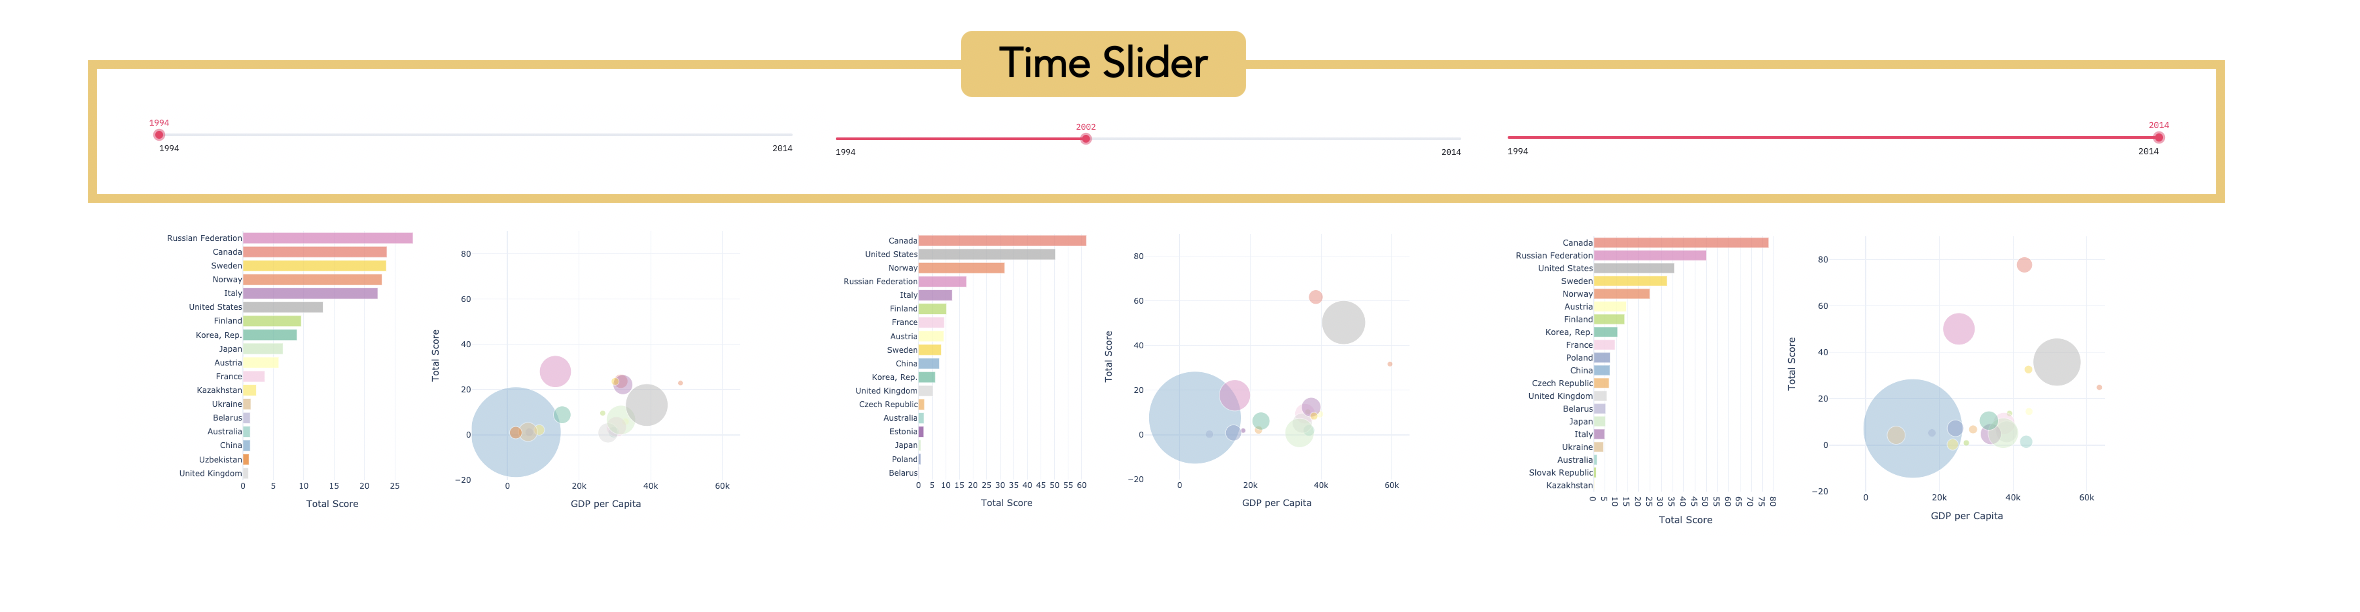
Also, I want to show the ranking of the countries more obviously, so I add a bar chart which changed with the bubble plot with time. Here it is!

The final solution helps the viewers to generilze to relationship between 'wealth' and 'Olympic performance'.
The time slider allow them to compare the countries' performance over time. While the widget for weighing over Gold, Silver and Bronze medals allow users to customize their criteria for 'GOOD' performance.


Who has the BEST athletes ?

Corresponding to Objective (1)


Version ZERO: Visualize athletes instead of countries

For this visualization, I still planned to use scatter plot to map each data points, but this time, for athletes rather than country.
Inspired by the professional solution of The Capital of Beer. My first thought it to find the trade-off between the the number of domans of each athlete wined medals and the total medals he/she wined. The color of each bubble encodes the country, and the size encodes a weighted score.


To make it more informatic. I designed to add interaction to it: when hover over the circle, users will see the detailed information of the represented athlete.
Moreover, since our objective is to compare the country performance ultimately. I will add a bar chart showing the total score of the athletes in that country.


Version ONE: Change the dimension

Everything looks good. However, when I dive into the data, I found that all athletes have no more than 2 skilled domains! That's a bad news since I can no longer use 'number of domains' as a scoring dimension. So I finally chose to use the same technique for balancing different medals as in the first visualization.


The next version visualization solution looks like this:


Version TWO: Change dimension again

One problem with the current bubble plot is that the bubbles overlapped with each other! Because it is very likely that differrent athletes have wined both the same number of gold medals and total medals.

Another the interesting dimension is the time. Are there more decorated athletes in recent years or in the past? Thus I add time to the axis and make the graph looks like this:


The final solution gives an overall country ranking with athletes score with a bar chart with the detailed information shown in the scatter plot. Thus it can not only help the viewers recognize who is the best athlete, but also which is the country with the best athletes.
With a widget for weighing over Gold, Silver and Bronze medals, users can customize their criteria for 'BEST'.


Who is good at What ?

Corresponding to Objective (2)(4)(5)

Version ZERO: I want to make something fancy!

I searched for some visualization works that related to Olmpic games, and find the Olympic Feathers.
That's super cool!And I thought I can make something similar to visualize the skilled sports for each country and show the time trend as well. I thought I could also link it with the first visualization: when a bubble is clicked, the 'feather' plot will show up accordingly.


But...that's only what I THOUGHT :)


Version ONE: Be realistic!

Building this Olympic feather plot is hard for a novice of D3.js like me, especially with the limited time. So, finally I gave in and decided to use convetional heatmap and bar chart:


But...I still want something FANCY :<


Version TWO: Another circular layout!


I still really like that circular layout with the radius axis representing the time and angular axis representing the sport discipline. Thus I gave it another try to show the total medals gained for each country, in each discipline, in each year, with the circle size encoding the total number of medals.
When hovering over, the user will see the years and number of medals wined encoded by each circle.


Combine them altogether, I get the final version of visualizating the skilled domains for each country:


Version Final: Small multiples

Add pie chart for each countries showing the overall percentage of medals wined in each sports. Visualize as small multiples to allow easy comparison between different countries.

The final solution answer use a bar chart to let the users know the countries win the most to least medals from 1924-2014. The heatmap shows the total medals wined in each discipline by different countries.
For the top 20 countries, we have a circular layout to show the trend of medals wined in each discipline over time. Different from using the time slider, this graphs positioning information slices for comparison within the eyespan.
Also, with the last small multiple visualization, viewers can easily compare the between different countries.


Interactivity

Score calculation

The score is calculated based on the number of Gold, Silver and Bronze medals, thus we need to find a way to weigh over these three numbers.
Initially, I was thinking of using the square with a square widget with a red dot to move around. However, it is hard to implement in Streamlit. Thus I choose two sliders to make the interaction:


Score calculation

For the visualization of the relationship between medal score and gdp, I implement a time slider to allow the viewers to specify their time of interest and showing them the change over time.


Interact with the circulr chart

For the circular chart, we allow the viewers to choose the country they are interested with a drop-down box. Besides the tooltips when hover over each item, there will be cross lines to help locate the year and discipline.


Interaction for small multiples

For the small multiple pie charts. I facilitate the comparison between the TOP6 countries by: (1) Allow clicking to select/deselect certain sports by legend; (2) Hover legend to show the corresponding slices simultaneously


Tooltips for detailed information

For each of the visualization, I add tooltips to each items. Thus when viwers hover over the item, they can see the detailed information in the text form.

Here are just some examples:


Data Processing

I won't go into the details about the data processing part in this blog. The data is processed with Python. For each part of three visualizations, I processed data with a separate jupyter notebook. If you are interested, please find the github repo to see the code at the bottom of the page.


Evaluation

I will design the following questions for the viewers to answer, evalute the visualization with both the accuracy and time latency of their responses.

  • In terms of the best athletes, who is the best country for winter Olympics?
  • Which country performs good in terms of medals?
  • Does the country wealth contributes to its performance in winter Olympics?
  • What are the popular sports for winter Olympics? Which countries are skilled at them?
  • What's the overall trend of medals wined by countries over time?

Moreover, I will analysis the user interaction behaviors with each widgets and their time spent on each graph to evalute how useful is each widget.

If it is possible, a questionaire asking about user experiences will help for measuring the viewer's cognitive workload and metal interest in the graph.


The static version: a poster

I made a poster to show the results with the static verstion of visualizations. You can download the high-resolution version at the bottom of the page.


The interactive version: a website

I built up the communicative visualization with the Streamlit framework. The interactive charts are made with ECharts and Plotly.

You can find the source code in the github link at the bottom of the page ;)

Here it is: The site deployed on Heroku


My Contributions

Design
Sketching
Coding
Telling a storing

Acknowledgement

This is a course project of SI649, Fall 2020, University of Michigan.
Thank you to Professor Eytan Adar and the all the GSIs.

Relative Links

You can find more information here:
[Github] : Get the source code of data processing and visualizations
[Document] : Download the high-resolution poster for the static visualization
[Website] : Go to the interactive solution site